NLSC Multidimensional National Spacial Information Service Platform
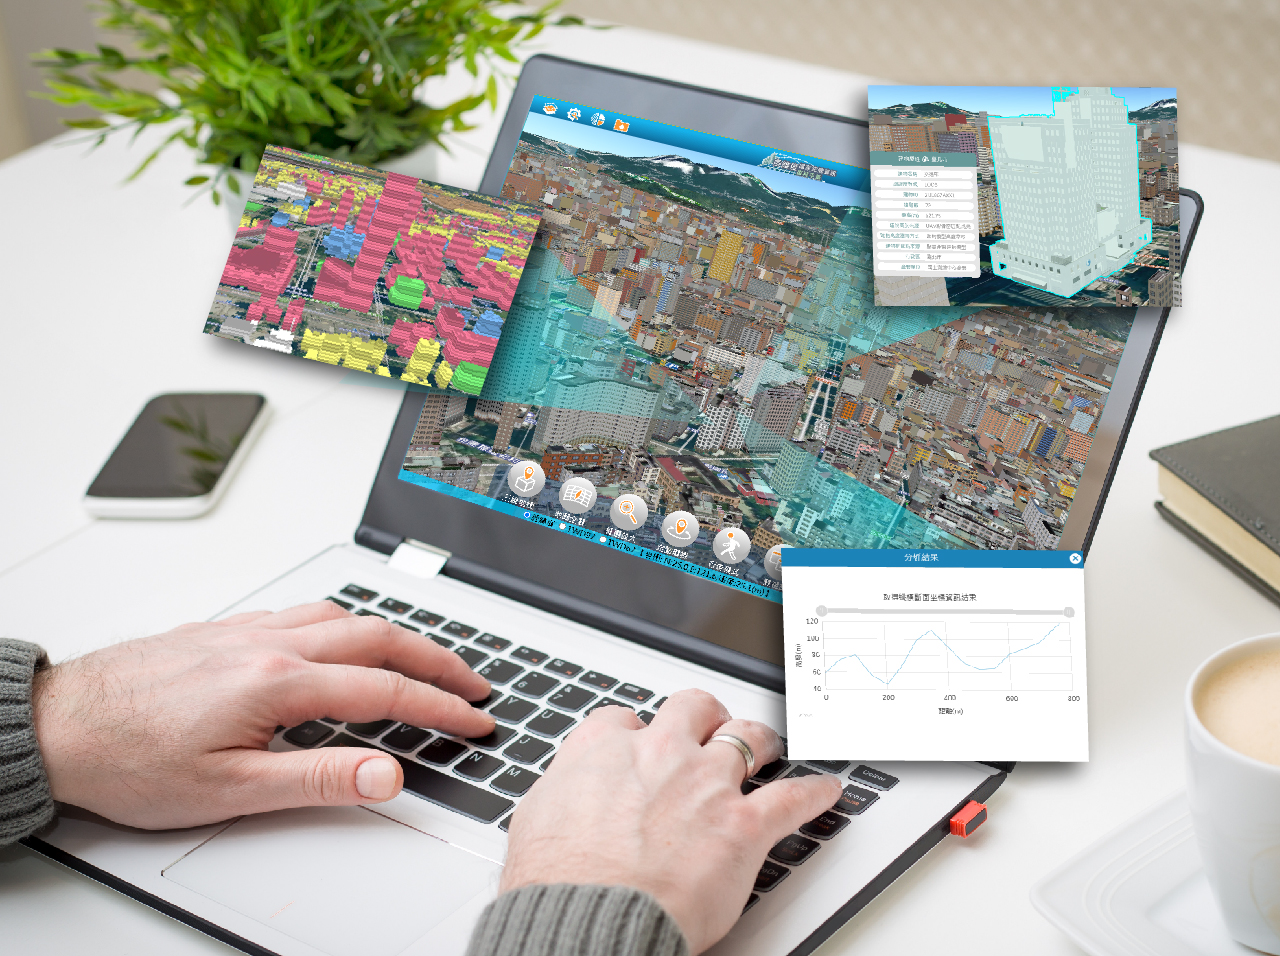
The NLSC Multidimensional National Spacial Information Service Platform is a national GIS platform that visualizes basic and foundational land mapping data, such as a general electronic map of Taiwan, cadastral information, and land use survey results, etc. The system also provides web services such as interfacing with and overlaying map data for viewing. Pilotgaea assisted the Ministry of the Interior in developing the system with our years of research in the field of GIS technologies and experience from long-term exchanges with industry, government, and academia. The platform's feature provides valuable service to the general public and assists in decision-making in various ministries with its features.
Besides updating the data of 3D structures and roads, national pipelines will also be integrated into the platform in the future. The integration will enable better maintenance management for pipelines, ensuring safety and increasing efficiency in pipeline management. The NDC also designates the platform as the showcase for pipeline integration that can assist in making decisions on pipeline-related policies.
Besides functionality, the platform also emphasizes the integration and optimization of map resources. While integrating the map information into the platform, we adjusted the data to make the following features possible:
1. Real-time Interfacing and Publishing to I3S and 3D Tile Services
To share national map data and collaborate with the general public, the platform provides an interface for sharing OGC 3D data in the I3S and 3D Tiles format. Besides converting map information into data that can be shown on the platform, the system can also publish services in I3S, 3DTiles and Pilotgaea's internal map format. The process of interfacing and publishing uses researched format conversion technology that significantly reduces the storage space of the data, maximizing the efficiency of data conversion.
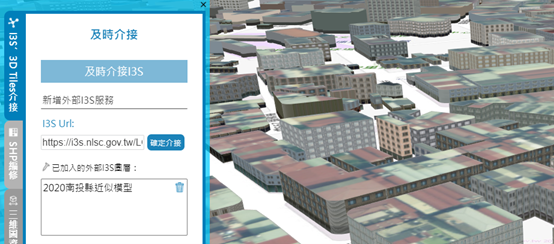
▲ Real-time I3S data interfacing
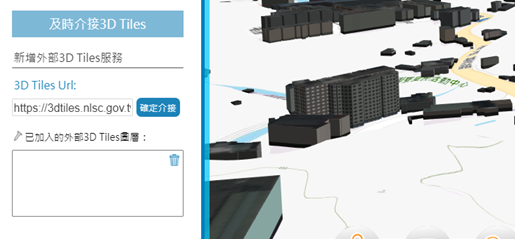
▲ Real-time 3DTiles interfacing
▲ Interfacing I3S Sevice from 3rd-party Systems(WRA 2D/3D GIS Platform)
2. Integration of Building Models with Varied Definition
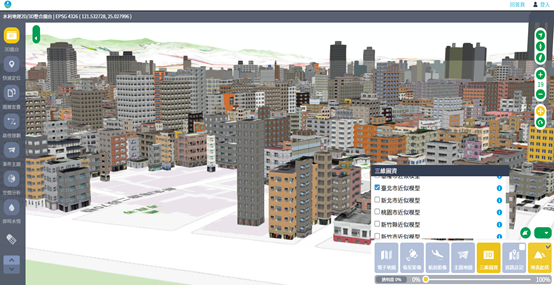
The platform can visualize building models with varying definitions. When the same building model with different definitions is loaded, an algorithm developed by Pilotgaea compares the model and keeps the building with a higher definition to ensure the best viewing quality.
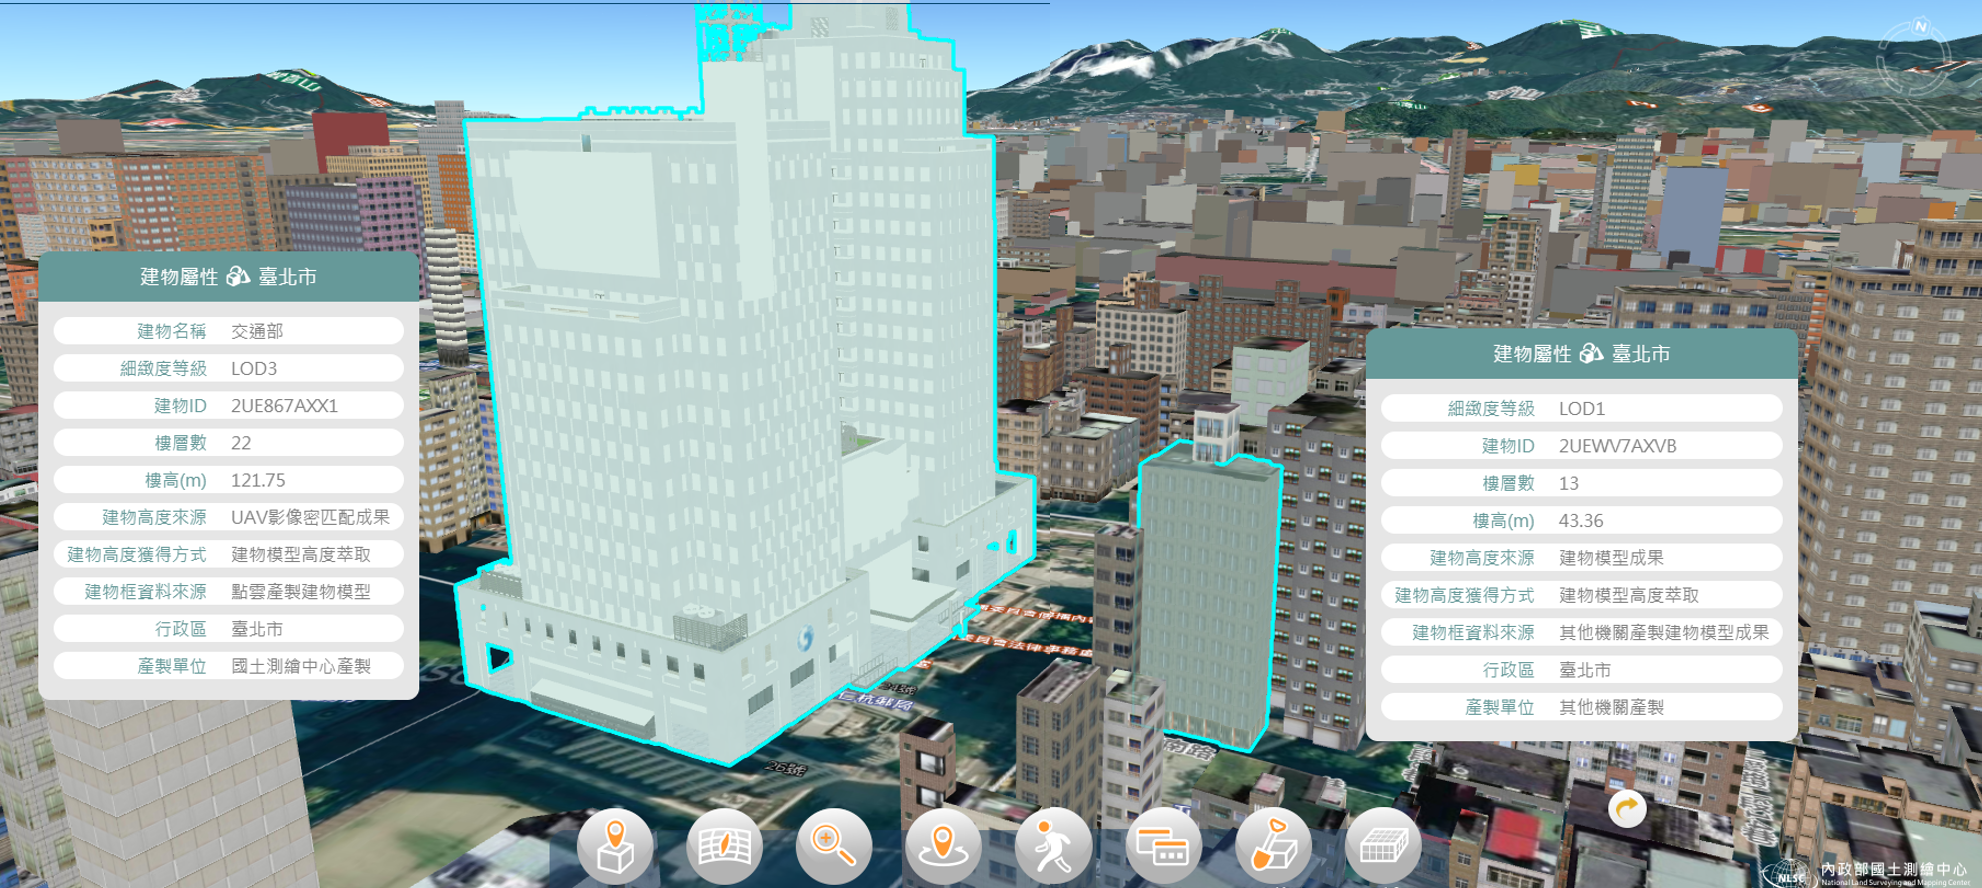
▲ Showing building models with different definition
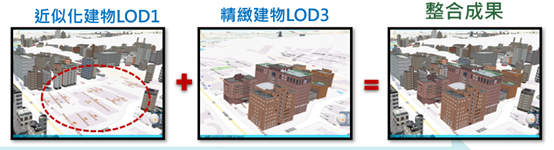
▲ Process of integrating building models
3. Integrated Display of Photogrammetry Models and Terrain
The platform filters out terrain area that overlaps with photogrammetry models to avoid obscuring them in low-laying areas with our image-dense range matching technology.
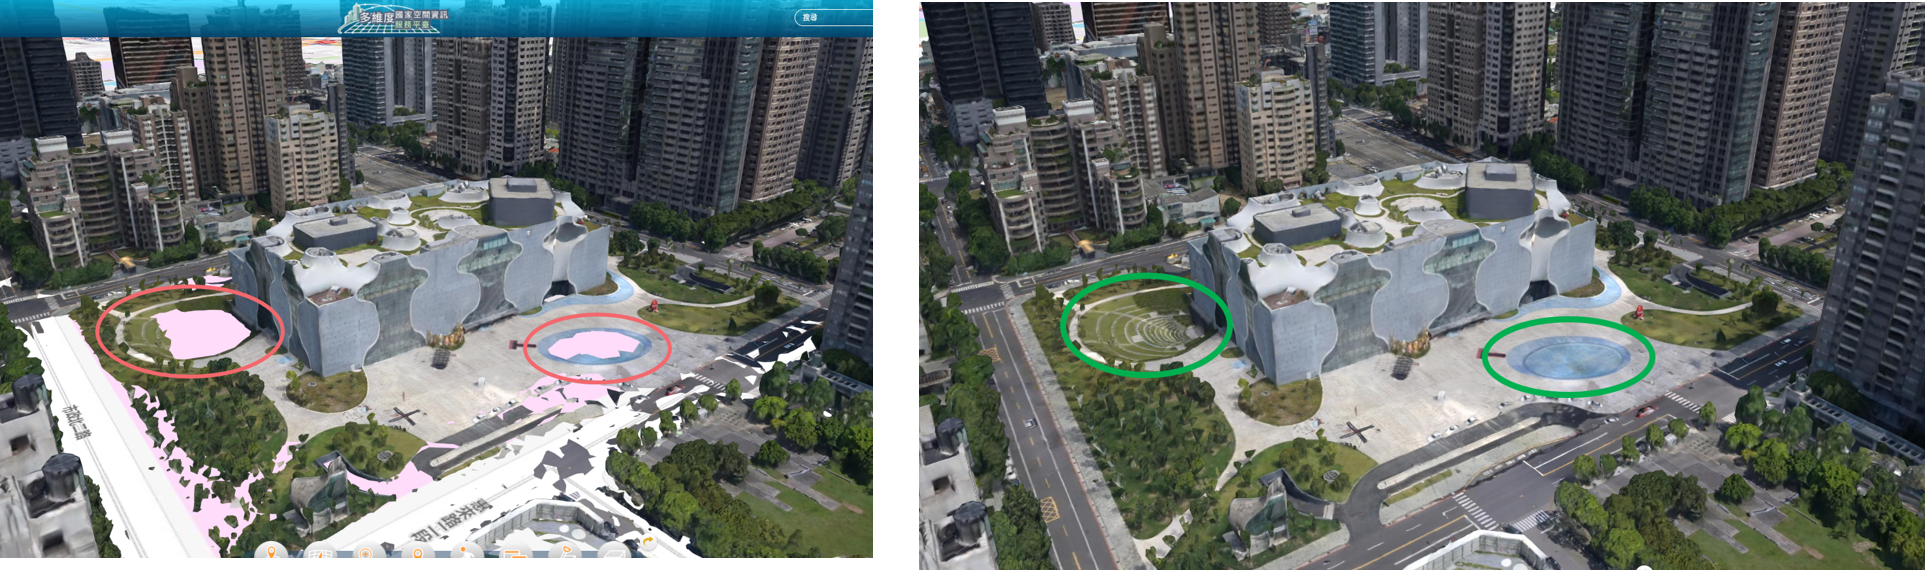
▲ Obsured photogrammetry model in low laying area before the process ▲ Fully displayed model after the process
Besides visualizing map data, the platform also provides diverse functionalities, making it a useful tool for the country.
1. Model Coloring
Normally, 3D models can obscure information displayed on 2D maps. With the model coloring feature, the models can be colored based on the colors of the 2D map data, resolving the issue. This can be applied to urban planning to see the zoning of land use data of the properties the buildings belong to.
.gif)
▲ Model colored based on urban planning zoning map data
2. Building Filter
When planning for new building projects, it might be useful to know the distribution of buildings in the surrounding area. The building filter feature allows users to filter building with a target floor height to check if taller buildings may obscure light for the project. The feature can also be used by urban planners for checking if buildings would affect flight paths for surrounding airports airports
▲ Selecting area for filtering floor height
3. Analyze Surroundings
Faclilities surrounding an area can be filtered out by categories such as business (stores, factories), education (libraries, schools) or undesirable facilities (gas stations, funeral services) for new projects or urban planning.
4. Terrain analysis
The platform can visualize detailed terrain features with a 10M DTM dataset. Terrain analysis tools can also be used to obtain detailed topographic information such as slope angle, wave direction, and view analysis. This can be applied to fields such as land development or water conservation.
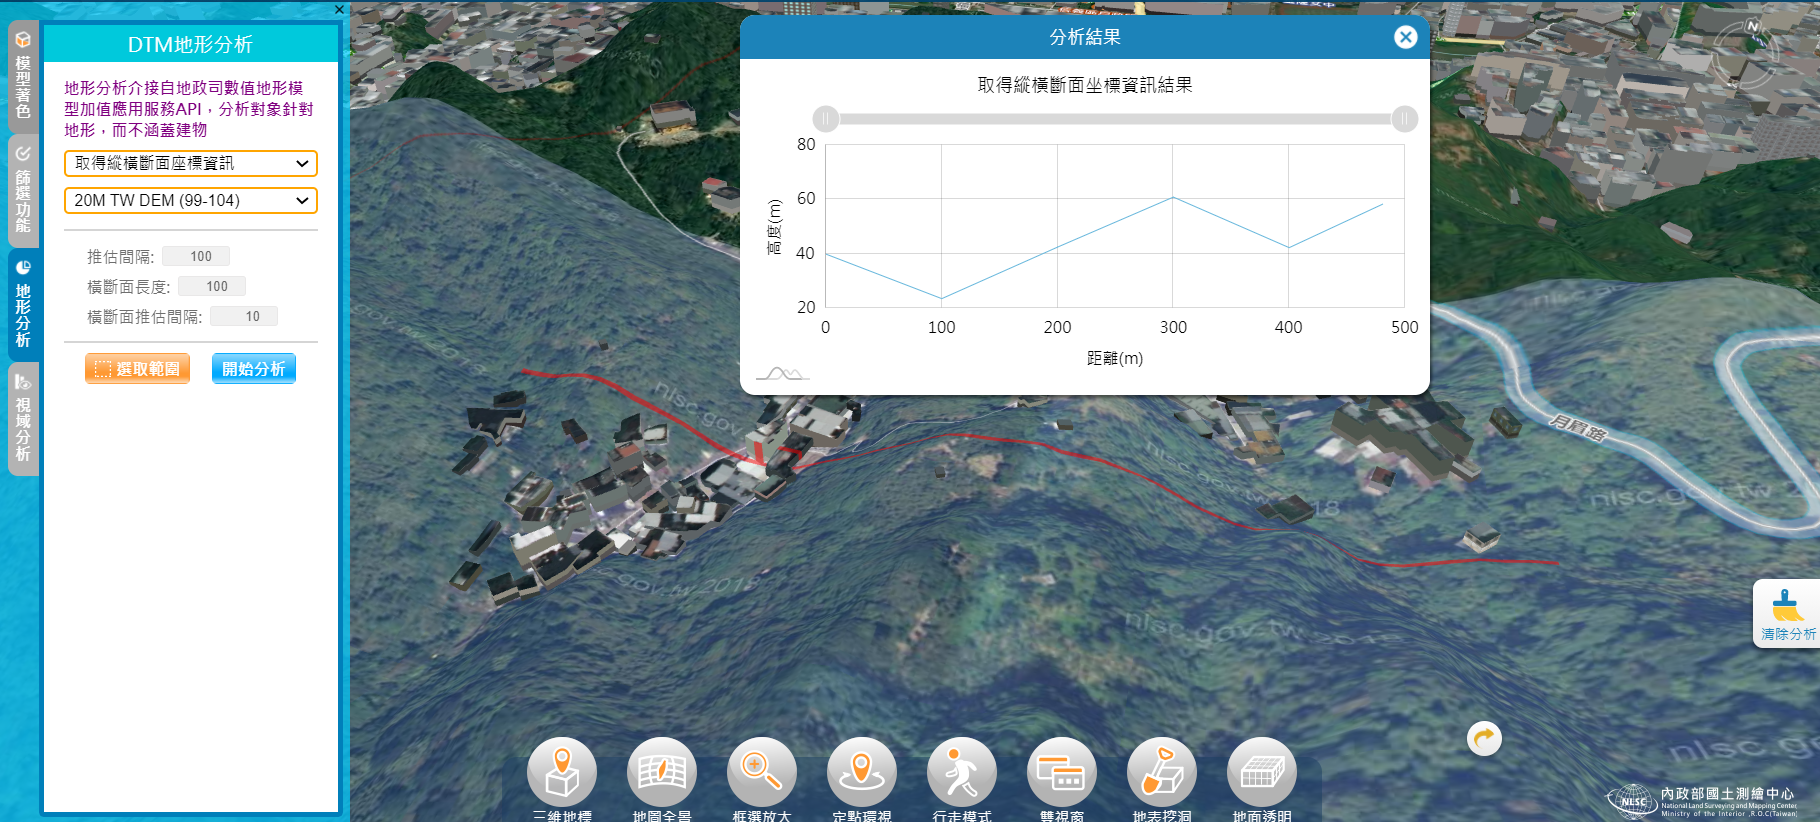
▲ Results of section analysis from topological data
5. View Analysis
View analysis can be used to determine the viewable area from a single point in the environment. This can assist in finding areas that are obscured by terrain or other structures in urban planning, choosing locations for observation decks, or planning patrol stations at military sites
▲Results from view analysis