O'View MapServer is a map server designed to operate directly on the web, with a simple interface for its diverse features. Supporting frontend platforms such as PC applications, mobile applications, web applications, and more. The platform has almost no data limit, allowing users to combine a large number of image overlays, elevation maps, vector overlays, 3D models, LIDAR data, and other resources in their applications. In addition to general location and data query features like Google Earth, the server also provides unique features that sets us apart from international competitors.
PilotGaea's latest O'View MapServer contains the following features
Development using JavaScript and the .NET framework
Supports 2D and 3D display on mobile devices
Supports interfacing with Oracle databases and IoT
Supports importing Blently, Revit, and QGIS data with plugins
OGC verified for WMS and WFS
O'View MapServer Modules
The map server provides diverse modules that supports displaying 2D and 3D data, data querying, measuring, and analyzing data on different platforms and services. The modules are highly customizable, allowing users to choose what they need for applications in their respective fields.
High-Efficiency 2D/3D Display
Our GIS system can display map services (WMTS), large data models (BIM, LIDAR, Photogrammetry) and simulate realistic light and water changes for an immersive user experience.
WMTS
Interfacing and displaying a near unlimited number of WMTS services, with layers that can be toggled on and off at any time and render at top speeds.
Natural features
PilotGaea applies physics based volumetric lighting modes useing Rayleigh and Mie models to create realistic lighting.
We convert the beauty of natural water bodies into virtual worlds with special algorithms to create realistic and beautiful ocean and river layers.
Large Model Support
Our system supports smooth viewing for large modelsets, providing a high performance viewing experience.
City-level photogrammetry model sets can be displayed smoothly, providing a high performance viewing experience.
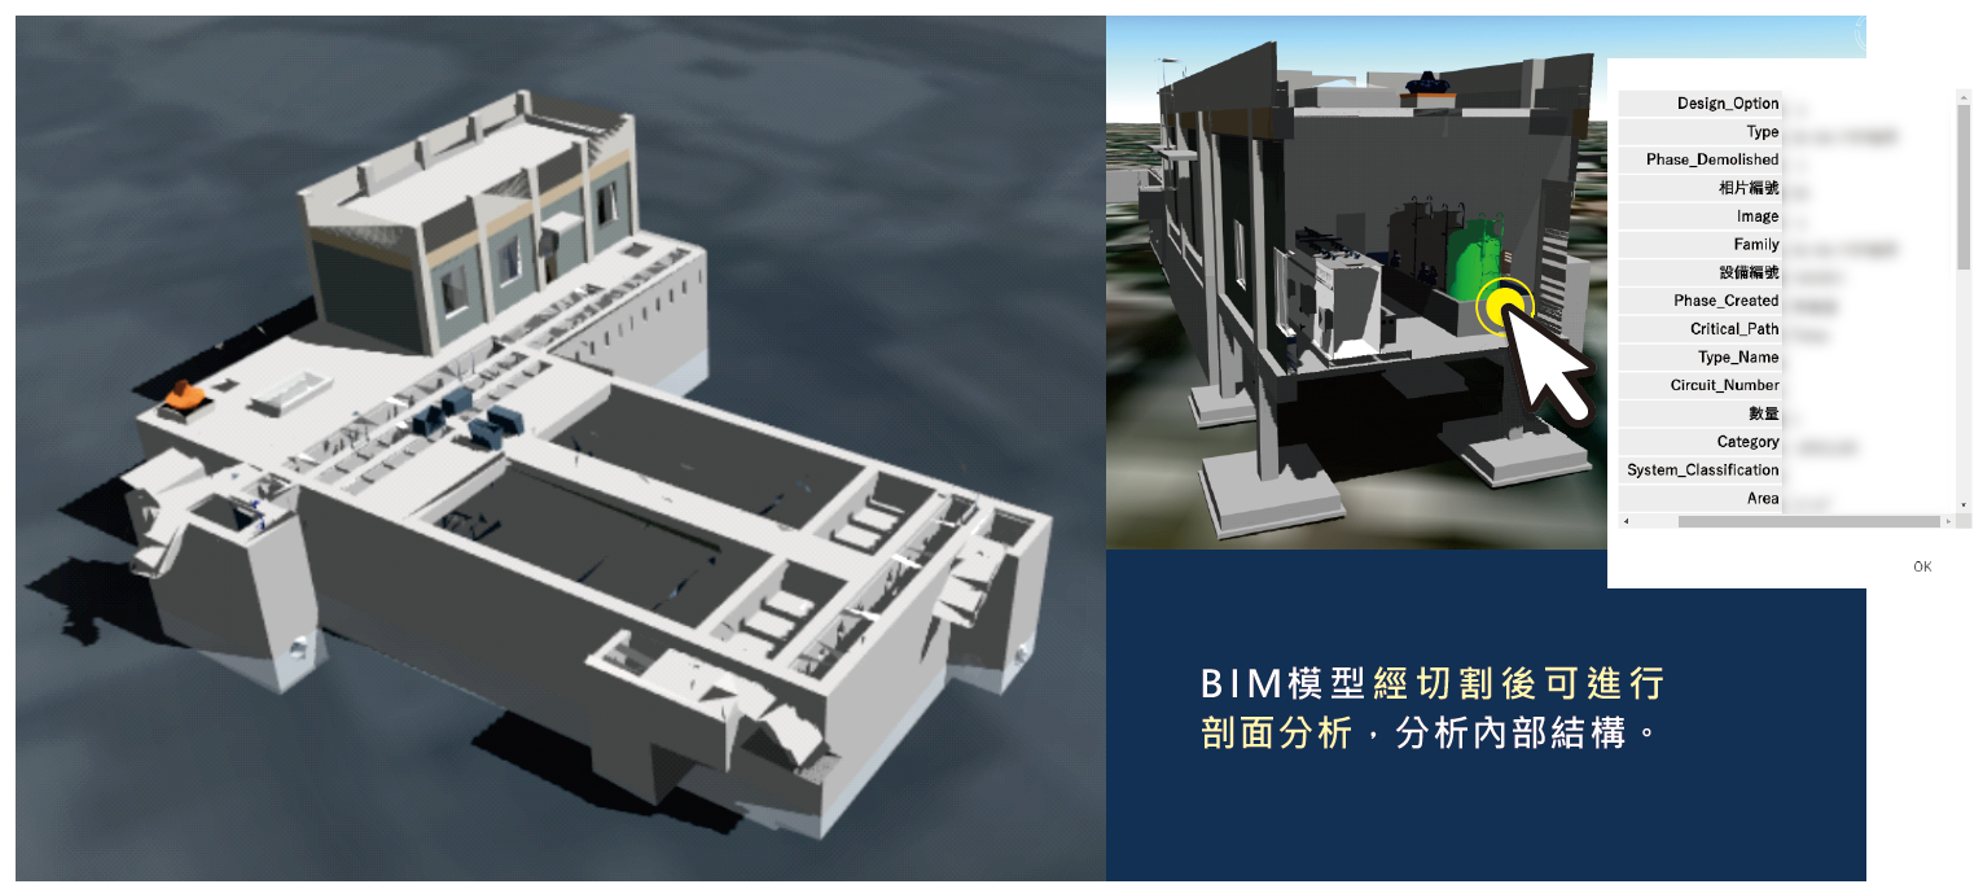
Fully display the large amount of data that comes with BIM models, importing all model properties, allowing users to perform section analysis or partial coloring, creating unlimited possibilities for data analysis.
Vector Data overlays
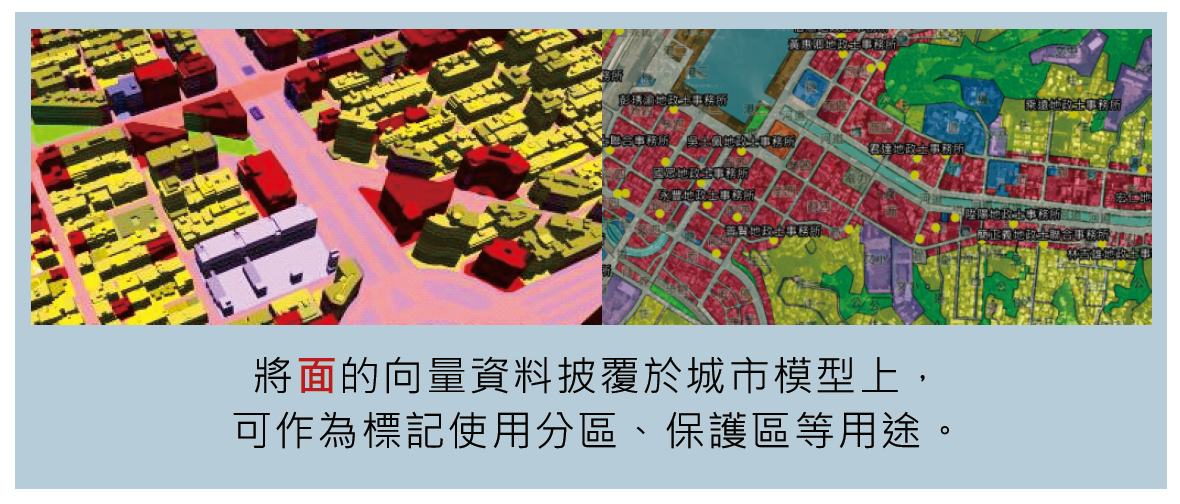
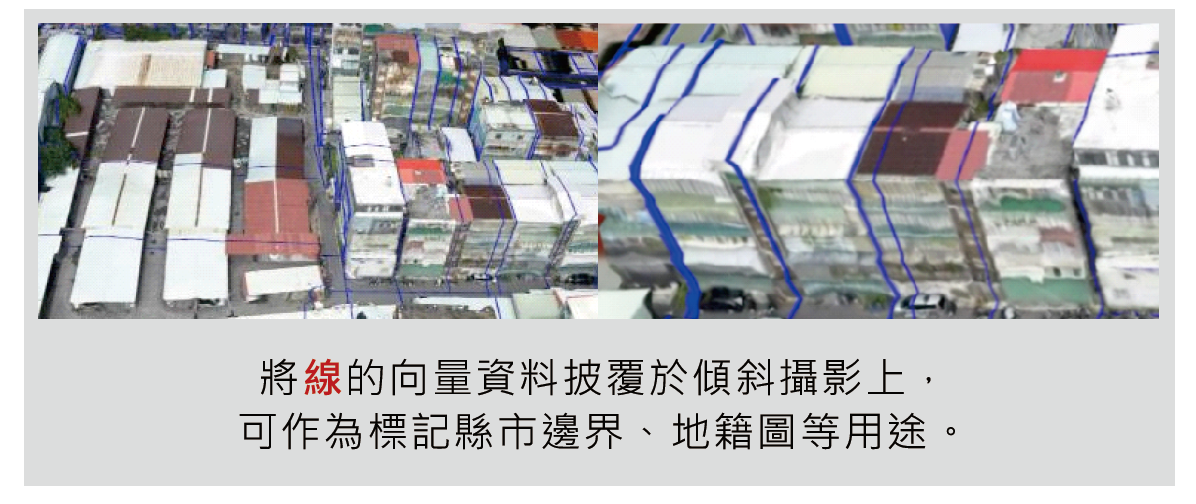
Our system supports rendering of vector overlays over 3D model layers, allowing users to view the them with 3D models simultaneously.
Pipeline Generation / Display
Unique technology allow us render large amounts of 3D underground pipeline data. Our system has processed pipeline datasets with over 2 million entries from local goverments. The professional analysis features for pipeline management also has wide applications.
Professional Analysis and Computation Deatures
We support geometric computations and general analysis features. Besides querying existing data properties, the system can perform analysis over multiple datasets for research purposes.
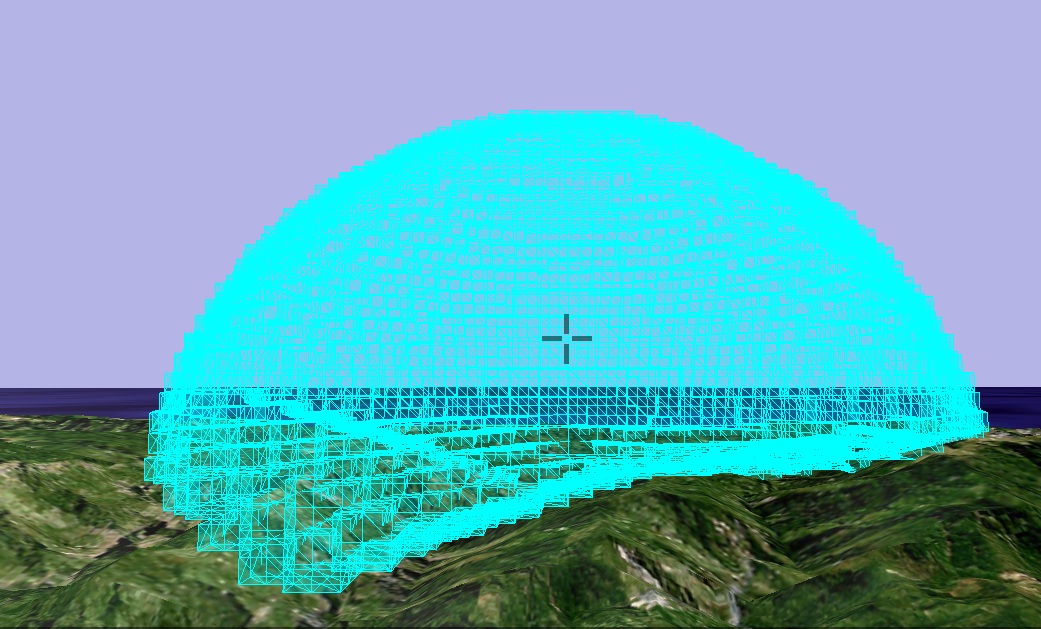
Aerial View Analysis
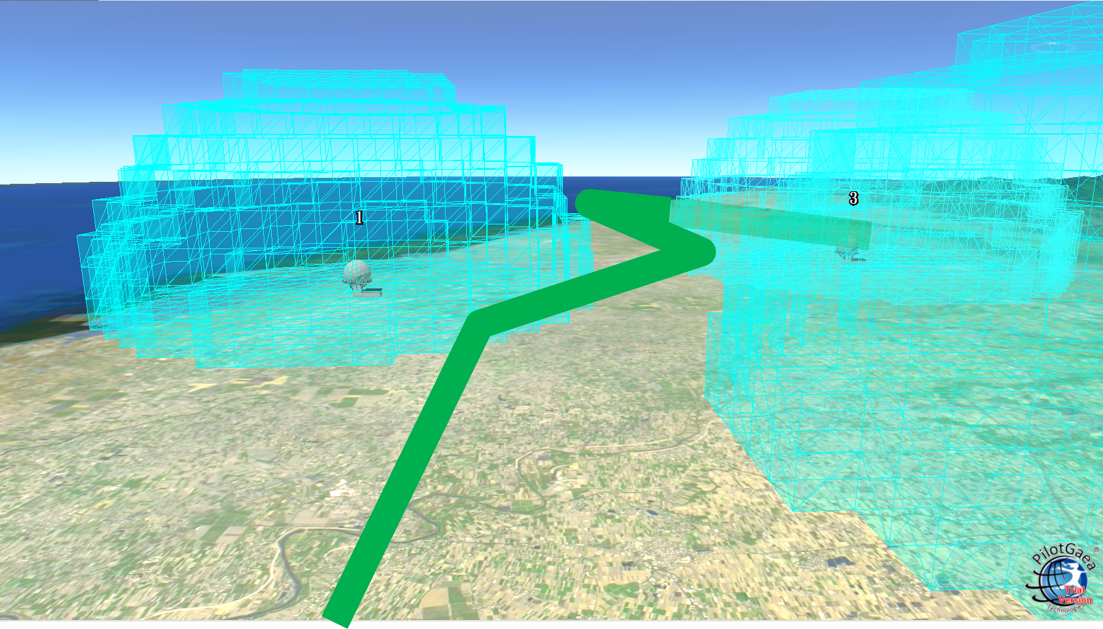
Best Route Computation
Flood Prediction and Simulation
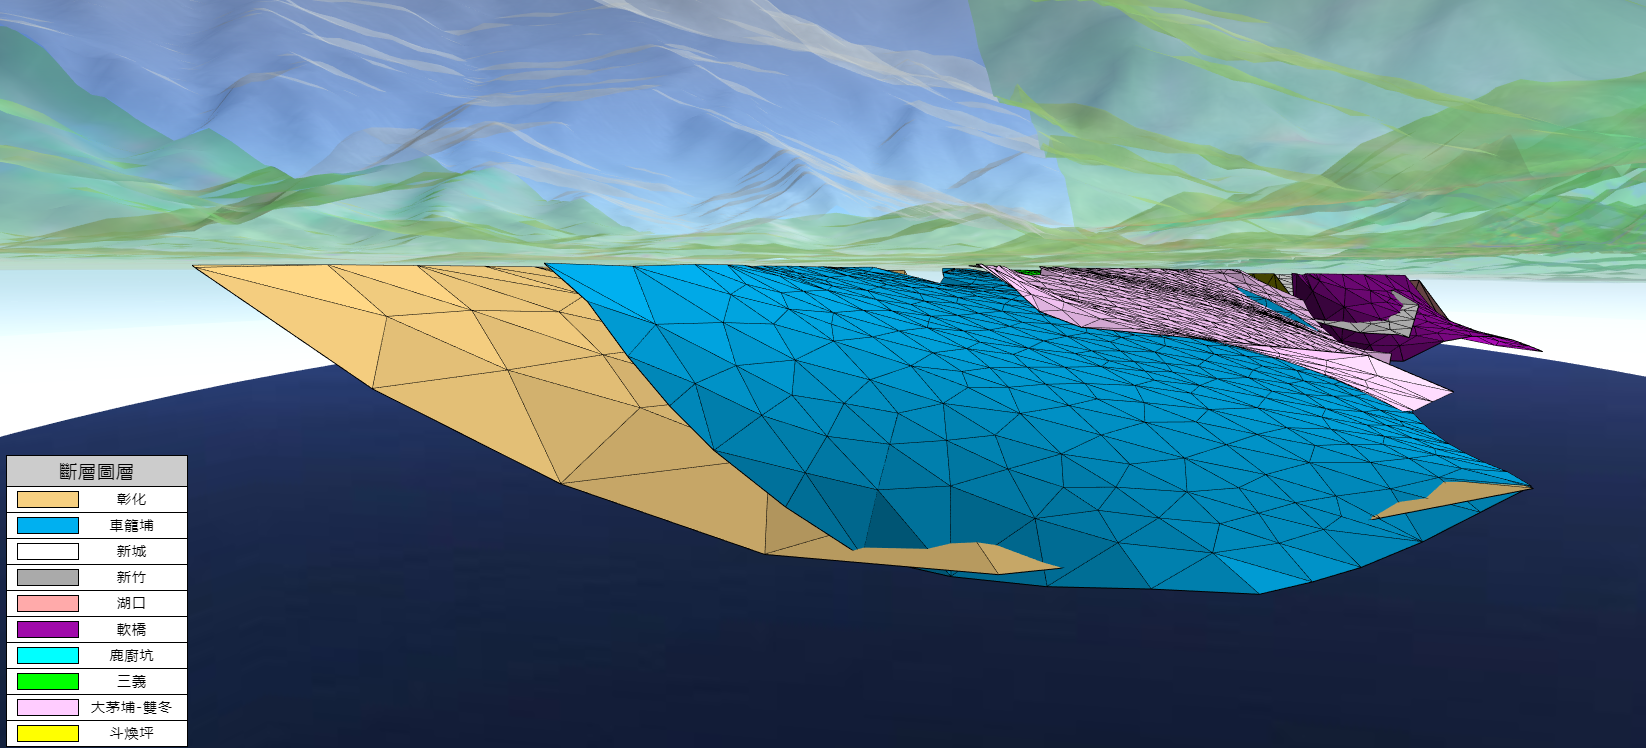
Active Faults
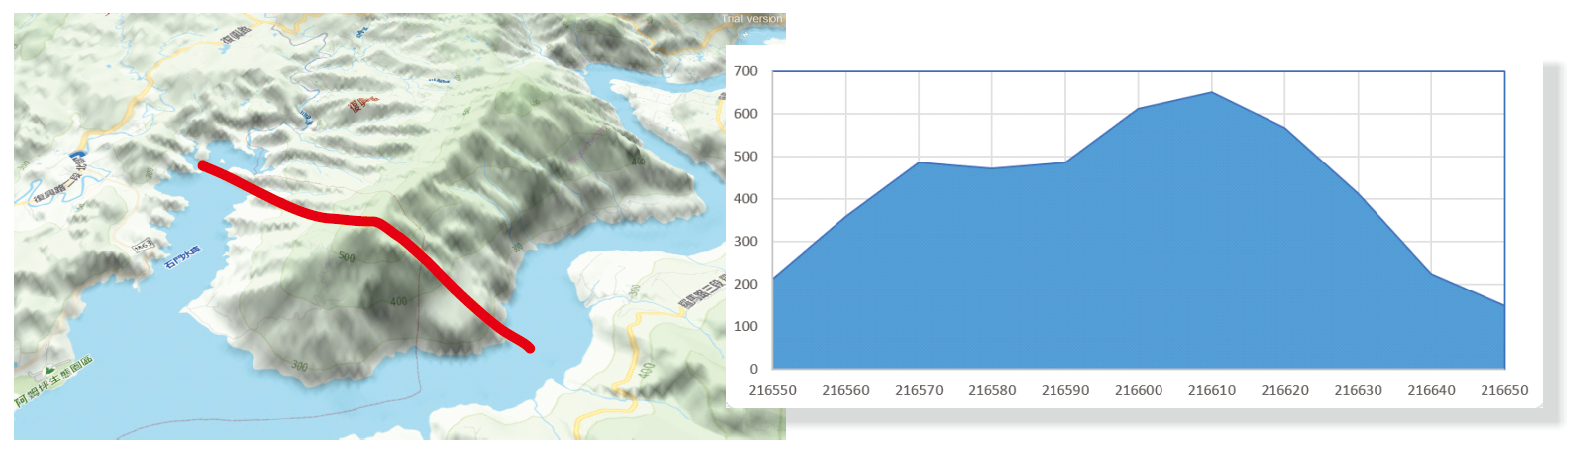
Terrain Section Analysis
Hole Excavation
3D Statistical Charts
VR Integration
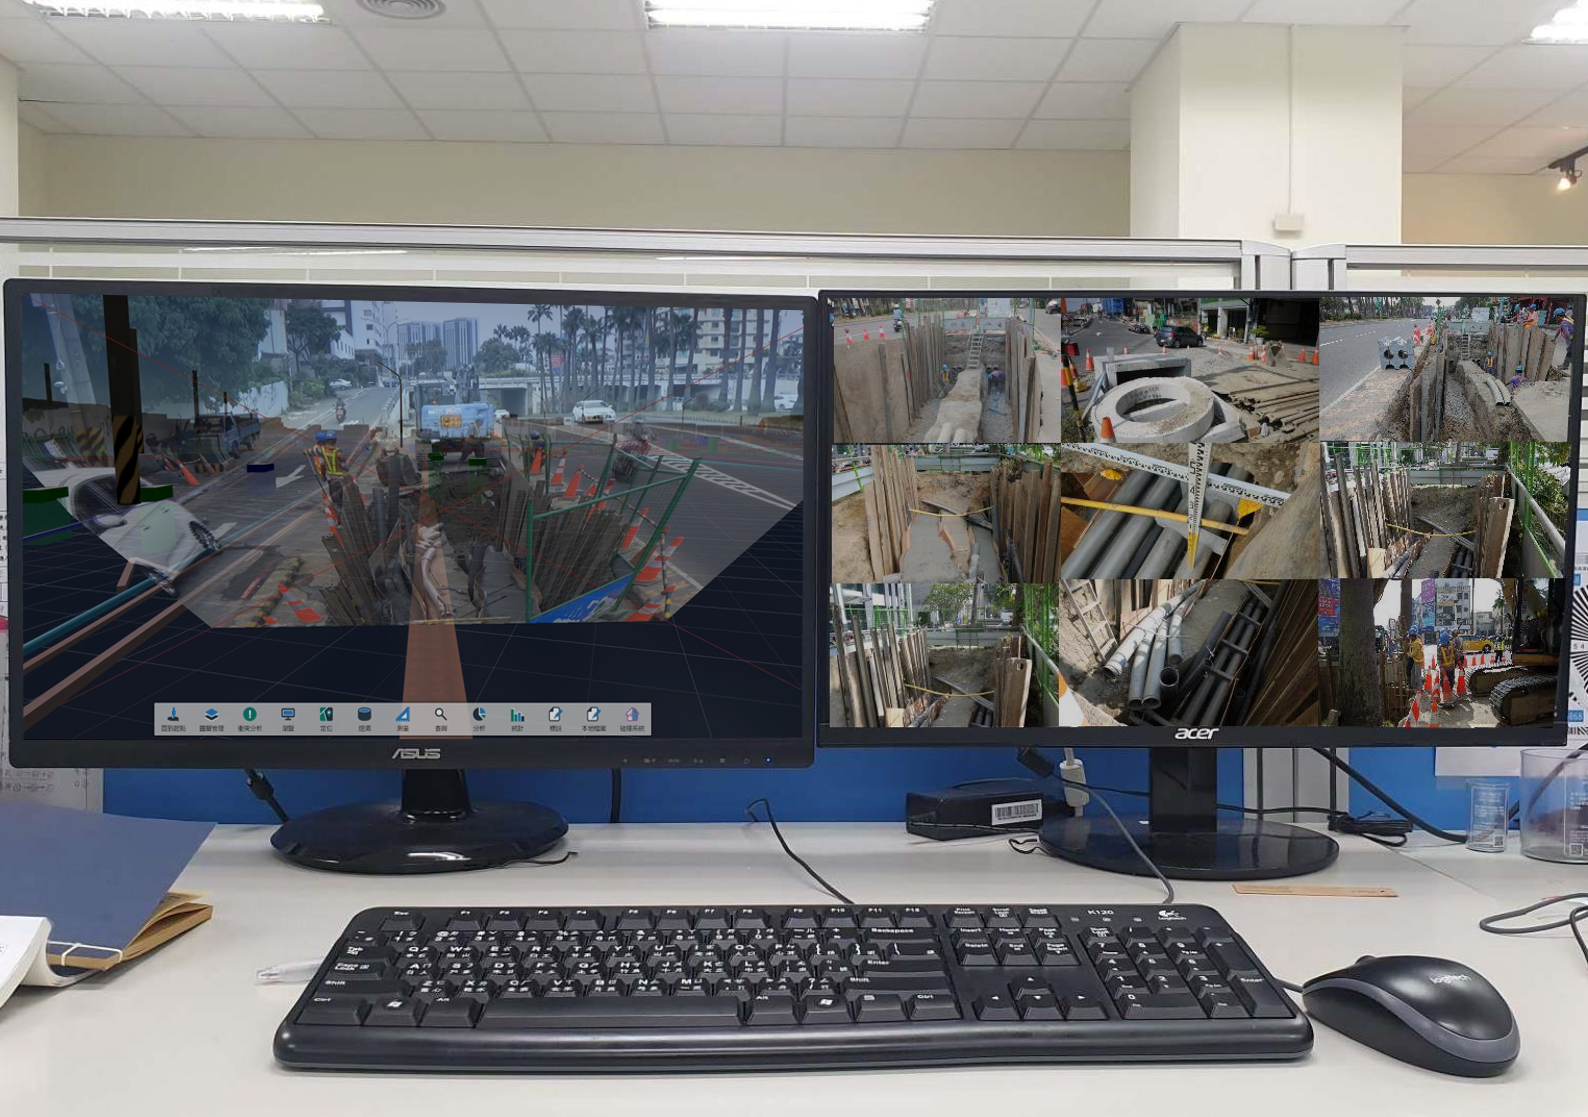
Layering video feeds on top of maps over terrains and 3D models.
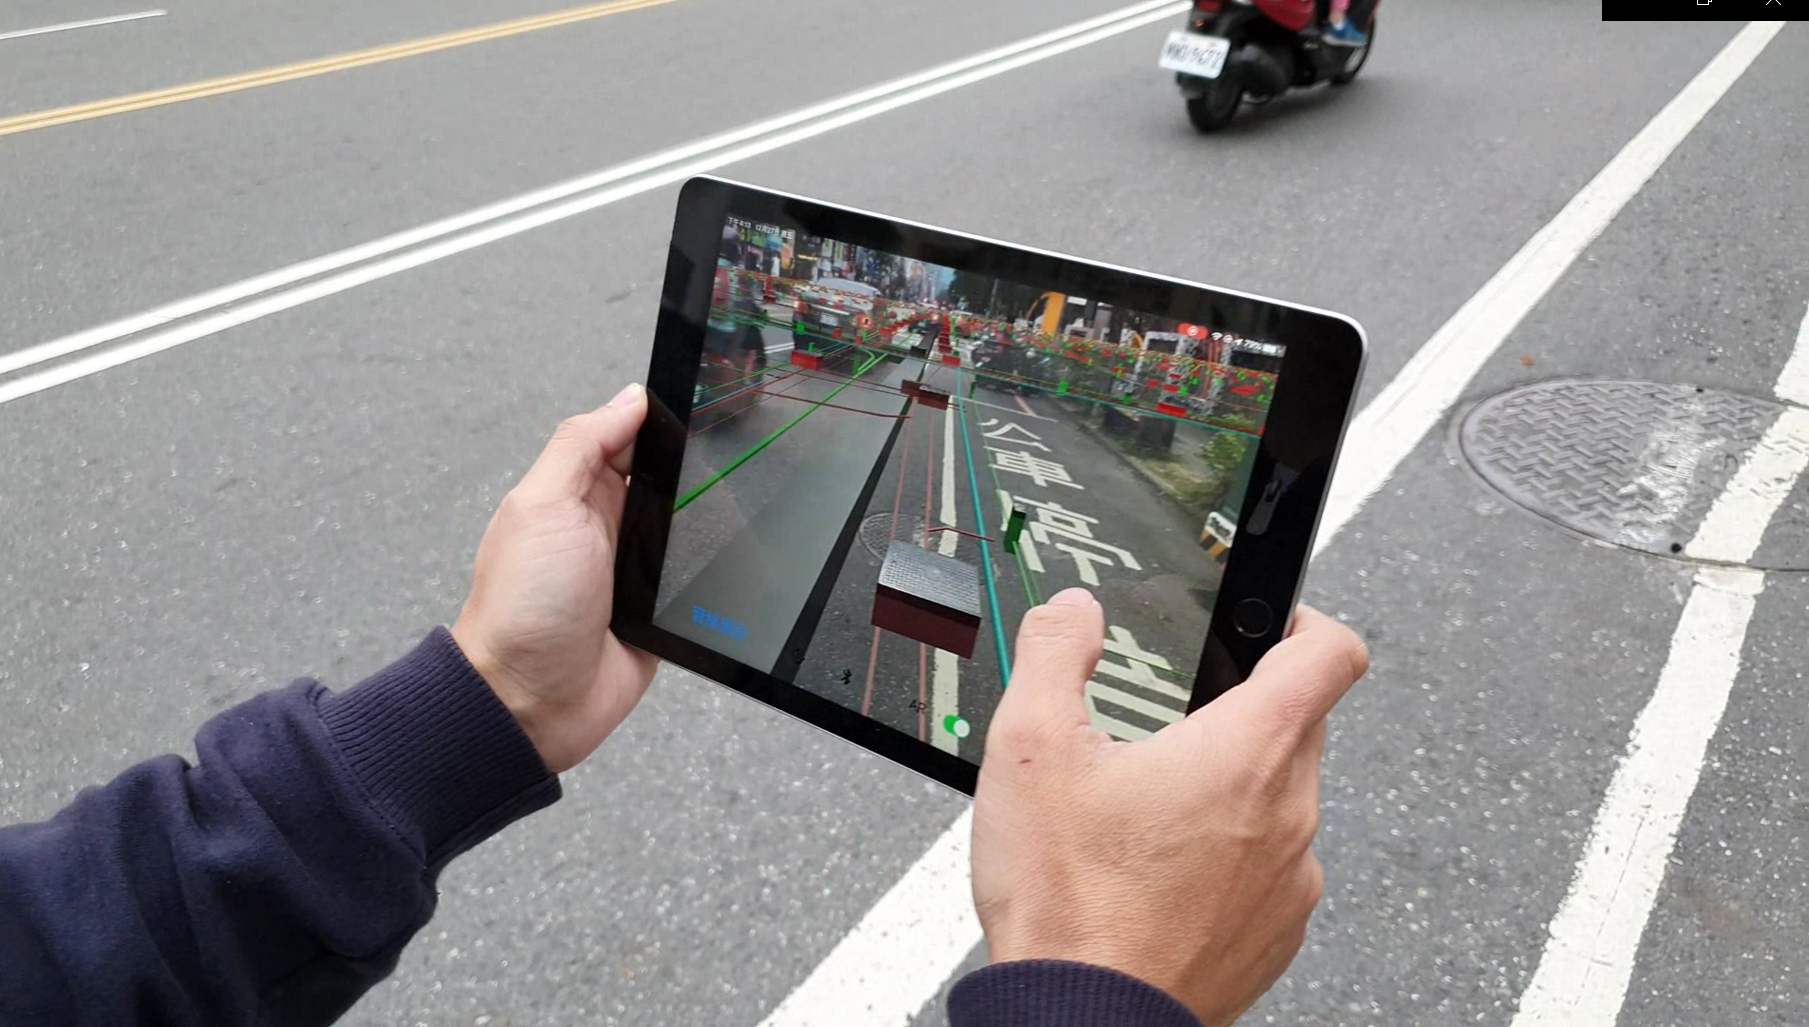
Support AR features for comparing digital data with real word conditions on mobile devices.